Around a month ago I started to learn how to use PostgreSQL to create, maintain, and query databases. It wasn't hard to find things in my personal life that were appropriate for databasing: Job applications, Hydroelectricity usage/charges, usernames and passwords. Putting data from these aspects of my life into databases has given me some great practice using a query language.
The thing about databasing that really trips me up is the concept of indexing. Depending on how you query (search) your database, any one record (row) in your database could show up in the 11th, 27th, 1st or 99th row of your query results. Hence, trying to access the record in which you stored your facebook username and password by its absolute row number just won't work. That's a concept for Python and not PostgreSQL (please correct me if I'm wrong!). What you can do however is assign each of your database records a unique numerical identifier and so any time you need to modify a single row, you can refer to it by its identifier no matter what the content in the other fields of that record.
What I wish I knew when I made my database is that it is REALLY easy to create a type of column in your table that automatically assigns unique numerical identifiers to your records when you insert new values into the table. When you're making the table in your database, declare your id column as type SERIAL. Then when inserting new values into your table, all you have to do is enter the word DEFAULT in place of a number that you would come up with yourself. The number id in the SERIAL column type seems to start at 1 by default, obviously incrementing by 1. Nice and simple. Following is an example:
CREATE TABLE test (
blah SERIAL
yadda varchar(50)
);
INSERT INTO test VALUES(DEFAULT, 'hello');
INSERT INTO test VALUES(DEFAULT, 'goodbye');
SELECT * FROM test;
blah | yadda
------+---------
1 | hello
2 | goodbye
(2 rows)
In my situation, I didn't seem to be able to make a SERIAL column for my existing table, or convert a column I already had. So, I needed a way of generating unique numerical identifiers after 100 records had already been inputted. I found two solutions (if there are others, please tell) to work for me. First the easy solution:
ALTER TABLE tablename SET WITH OIDS;
OIDS stands for Object Identifiers. When you use the above statement, PostgreSQL assigns a unique numerical identifier to each row in your table. This solution didn't look as clean to me as the scenario where the SERIAL type column was made when the table was made. The raw value that the OIDS in my table start at 16522, which is a little weird. I think this might be due to data that I have in other databases on my computer, but I can't be sure right now. The bonus is that the OIDS seem to have been assigned roughly according to the order in which I inputted these records into the table in my database. Thus it's a simple solution and allows me to refer to any one record by a simple unique identifier. I've read that the raw value of these OIDS will wrap around to something very small after you reach about 4 billion records. I don't feel in danger of that using PostgreSQL for personal matters though!
The next solution was more difficult, but gave me nicer results. First you need to figure out how you want to order the records in your database. I wanted to order them by date, so let's call my record dating column rdate. Unfortunately, many records were inputted on the same date, which means if I only relied on the date for ordering, I would get many records having the same numerical index. So, you have to take advantage of as many additional fields in your table that will make your record unique, and ensure that the following process results in as many different numerical identifiers as there are records. Let's say that in addition to specifying rdate as your ordering column, you also specify columns yadda, and blah. Also, your id variable is simply named id. You would then define the following function in PostgreSQL (my reference for this function comes from a pgsql mailing list posting):
CREATE OR REPLACE FUNCTION reorder_table() RETURNS INTEGER AS '
DECLARE
newcode INTEGER ;
table_record RECORD ;
BEGIN
newcode := 1 ;
FOR tablerecord IN SELECT * FROM tablename ORDER BY rdate LOOP
UPDATE tablename SET id = newcode
WHERE rdate = table_record.rdate AND yadda = table_record.yadda AND blah = table_record.blah;
newcode := newcode + 1 ;
END LOOP ;
RETURN 1;
END;
' LANGUAGE plpgsql;
Once you've entered this in, all you have to do is call your function through a simple statement: SELECT reorder_table();. If your inclusion of yadda and blah made each record in your table unique enough, then you will now have numerical identifiers ranging from 1 to the total number of records in your table! Of course if you want your numerical identifiers to be assigned according to the order of a different column in your table, replace rdate in the SELECT statement in the above function with the column name that you want as your ordering column.
What I like about using the OIDS in my situation is that the identifers are automatically generated, whereas I would need to run the above function every time I update the table in my database in order that every record has an identifier. Suffice it to say that in the future, I will create a SERIAL type column next time I need identifiers like this!
Thursday, January 28, 2010
Wednesday, January 27, 2010
Update your Rogers HTC Dream from Ubuntu
As with everybody else who owns an HTC dream/magic from Rogers, I recently started to get pestered to apply a software update to my phone so that I could safely call 911 and still be able to use my data plan. Most times I'm a pretty lazy person, and so I only got around to doing this AFTER Rogers took my data connection away from my phone. When I looked into it at first, it looked like the phone update could only be done using Windows software. Well that's a big problem for me because, as you know, I only use Ubuntu Linux on my computer!
I ended up speaking with a Rogers representative on the phone and asked her what Mac users are doing about this software update, thinking that the solution for them might be good for me too. It turns out it was, and now my phone is updated and back to full functionality. Of course all the programs I previously downloaded to the phone from the Market are gone, but I don't care much. Here is what you need to do to update your phone without HTC's annoying Windows software:
1. First you have to download a zip file containing the update (just a single file really, click here for the file).
2. Connect the HTC dream to your linux machine via USB, pull down the notification area, press your finger on the USB connected notification, and press Mount.
3. Now you'll see a notification that you've connected a media device on Ubuntu (or whatever other graphical form of linux you use). Tell your computer to open up the folder of the connected device.
4. Extract the contents of the zip file you downloaded in step 1 to the root of your HTC dream's microSD card.
5. Now turn off your HTC dream.
6. Once your HTC dream is off, press and hold 2 buttons together: the Camera button and the Power button.
7. After a few moments your HTC dream's screen should show something similar to the picture below. When you see that on your screen, press the trackball (Action) button.

8. When the HTC dream tells you that it's finished, it will ask you to press the Action button to reboot. Press the trackball when that happens and you're done!
I ended up speaking with a Rogers representative on the phone and asked her what Mac users are doing about this software update, thinking that the solution for them might be good for me too. It turns out it was, and now my phone is updated and back to full functionality. Of course all the programs I previously downloaded to the phone from the Market are gone, but I don't care much. Here is what you need to do to update your phone without HTC's annoying Windows software:
1. First you have to download a zip file containing the update (just a single file really, click here for the file).
2. Connect the HTC dream to your linux machine via USB, pull down the notification area, press your finger on the USB connected notification, and press Mount.
3. Now you'll see a notification that you've connected a media device on Ubuntu (or whatever other graphical form of linux you use). Tell your computer to open up the folder of the connected device.
4. Extract the contents of the zip file you downloaded in step 1 to the root of your HTC dream's microSD card.
5. Now turn off your HTC dream.
6. Once your HTC dream is off, press and hold 2 buttons together: the Camera button and the Power button.
7. After a few moments your HTC dream's screen should show something similar to the picture below. When you see that on your screen, press the trackball (Action) button.
8. When the HTC dream tells you that it's finished, it will ask you to press the Action button to reboot. Press the trackball when that happens and you're done!
Sunday, January 24, 2010
Pylab, R, and QtiPlot Plotting Compared
Today I want to compare and contrast the plotting of statistical graphics in three very neat software packages freely available:

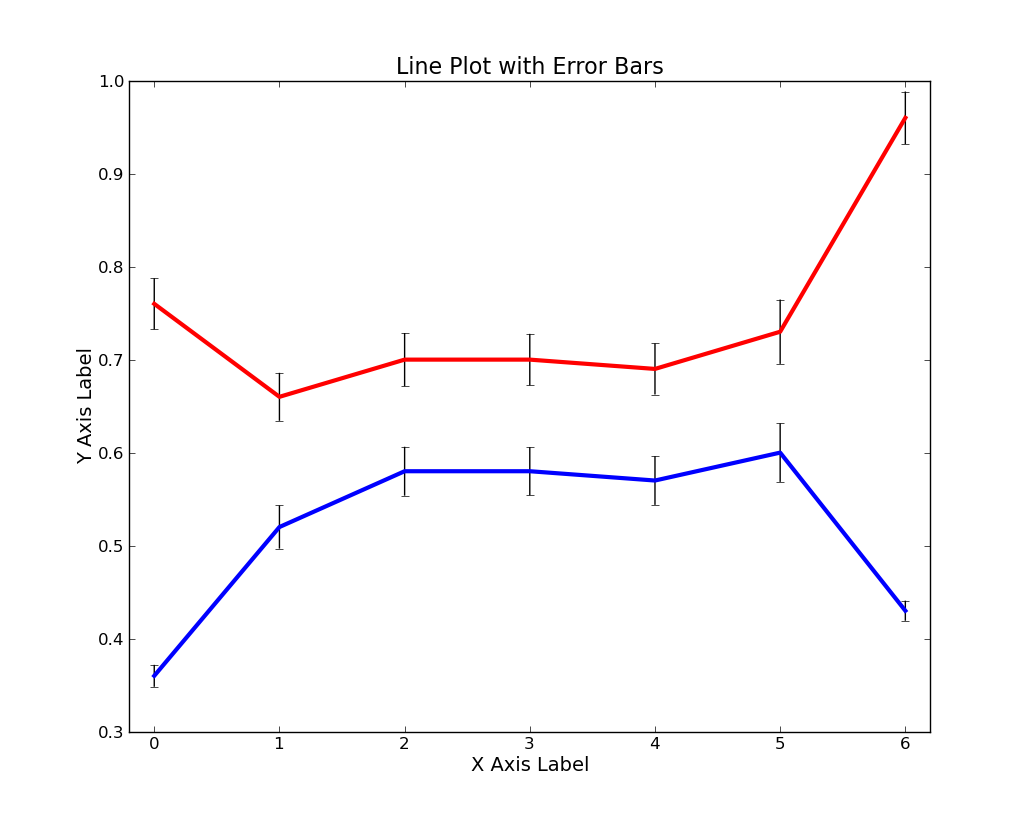
In the sample dataset above, I've included an "X Axis" column composed of 7 integers simply called X. I've also included two Y columns of means and two columns containing the Standard Errors of the datasets from which those means came. My plotting aim was to create a plot containing two lines describing the two Y columns and error bars matching the values from the two Standard Error columns.
Pylab plot

R plot

QtiPlot
As you can see from the above plots, no one of these three software packages produces a bad looking plot. Some of the graphical parameters (such as font size, type of major axis ticks, whether or not a full box is drawn around the plotting area, and how far the plot title is from the top of the plotting area) are different from program to program, but that's more a matter of my unwillingness to get the programs to output exactly similar graphs than an inability in the programs themselves.
How I got the plots using Pylab and R
First and foremost is the fact that Pylab and R require you to type in some code to do your plotting whereas QtiPlot gives you a point-and-click GUI interface to complete the task. Pylab and R have their own idiosyncratic syntax for plotting, but thankfully neither requires much more code than the other. If you didn't know already, Pylab is a module of python and therefore allows you to seamlessly weave plotting commands into pure python code. It will therefore be advantageous for anyone who already has a Python background to use Pylab. Below I will show you the code I used to make the plots.
Pylab via IPython
R
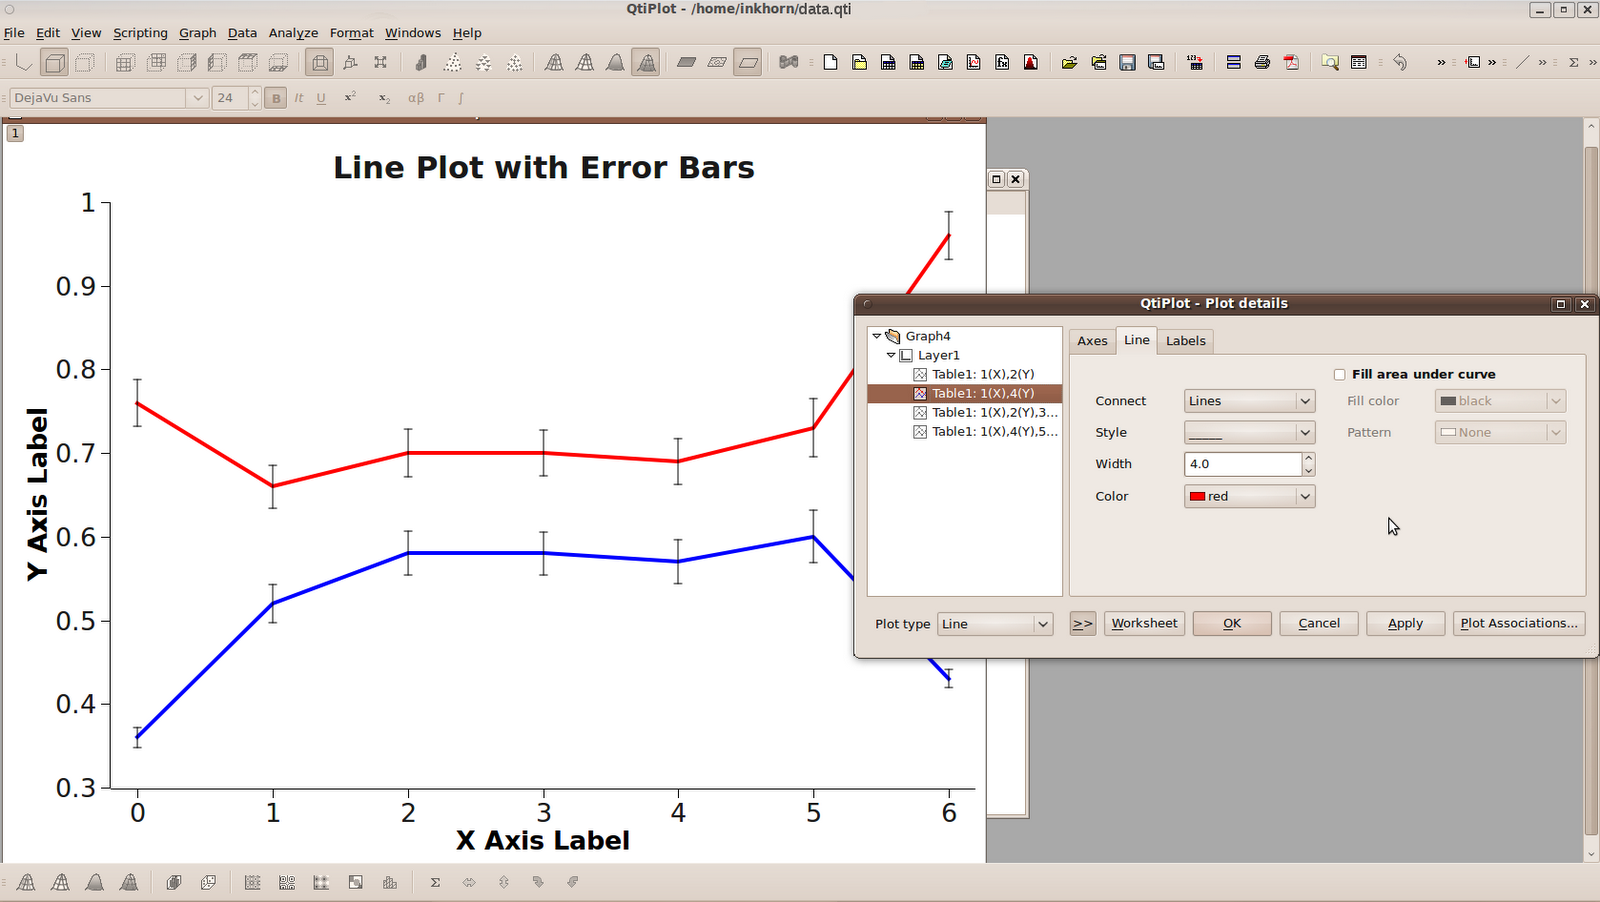
How I got the plot in QtiPlot QtiPlot follows a very similar concept as Excel. Namely, it provides table-space to enter in your data, allows you to make plots from your table data, gives you easy point-and-click access to manipulate each component of your graph, and lets you save data and plots together in one project file. To get to the plotting, first you have to click File > Import ASCII ..., which brings you to the screen shown below:
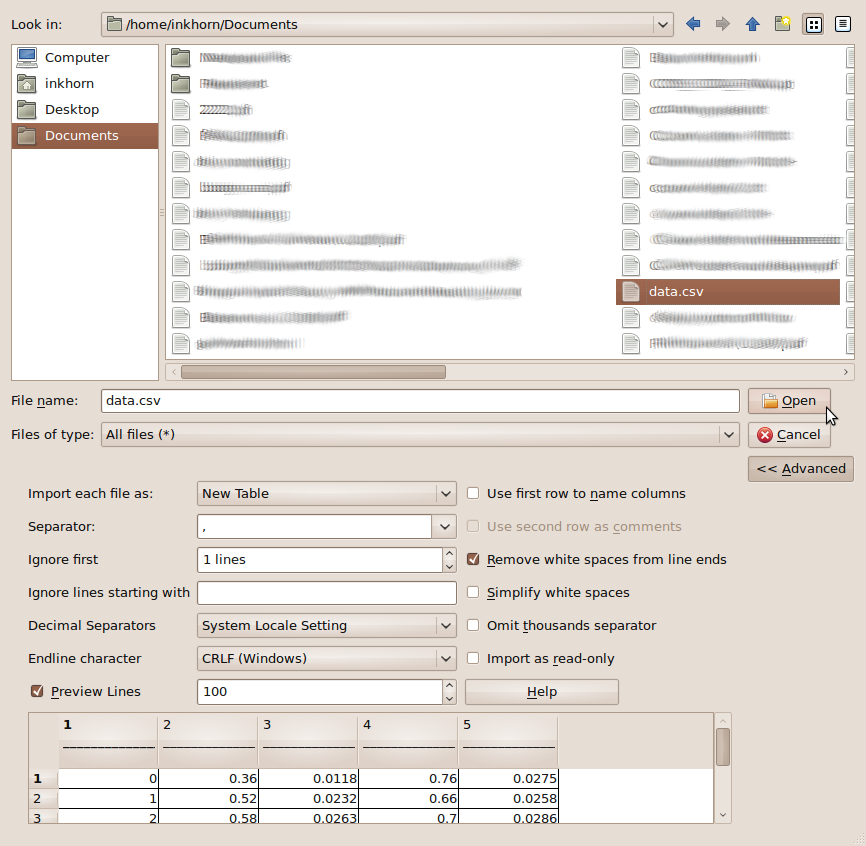
You then choose your data to import, specify the separator, whether or not you want to ignore lines at the top, then press OK.
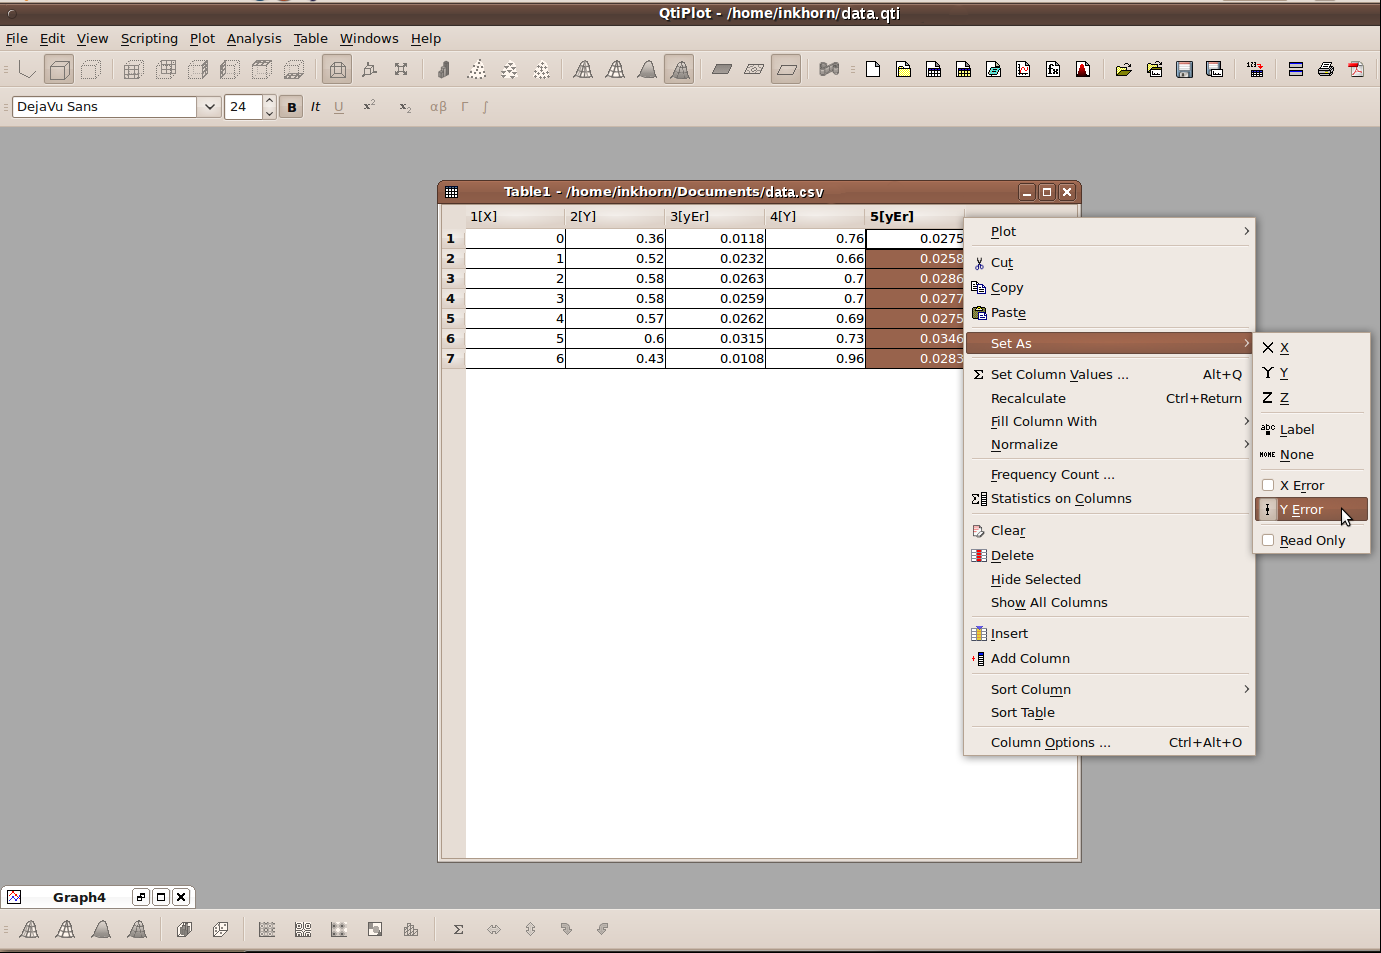
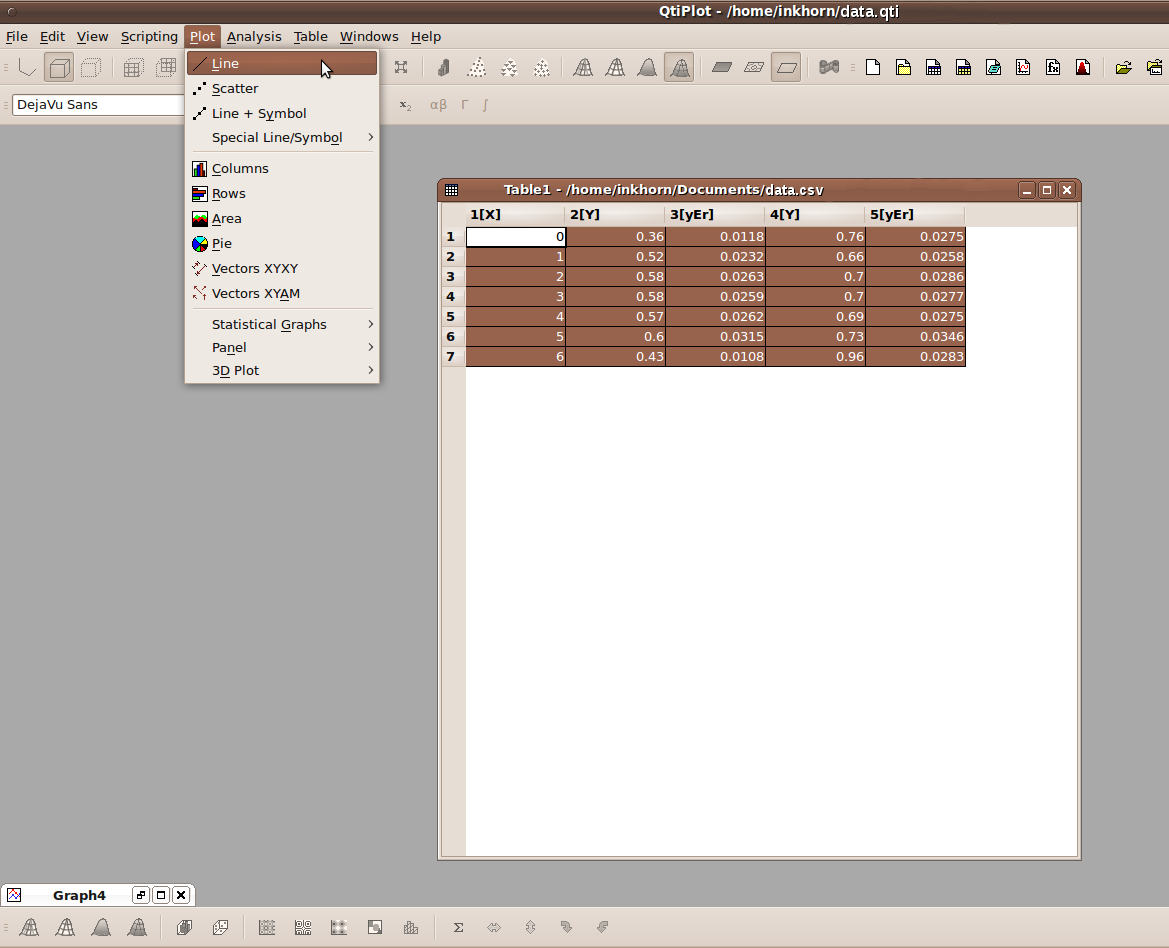
You are then shown your data in a Table view and must now right click on the columns and set their roles as shown above. As you can see, your columns can represent X variables, Y variables, Y error variables, even 3rd dimension, or Z variables. When you're done setting your column roles, navigate to the Plot menu and click on Line, as shown below.
A line plot will then be generated, using default values that you can change to your heart's content. The plot title and axis titles are very easy to change; all you have to do is double click on them and edit the default text that is already there. If you want to change any other aspect of the graph, it suffices to right-click on that part of the graph, and then click on Properties, such as what I did below with one of the lines on the graph.
You can also modify how you want each of your axes to look by right clicking on the numbers of that axis and again clicking Properties. You can then change some general graphical properties of each axis, or change the way that the axis is scaled.
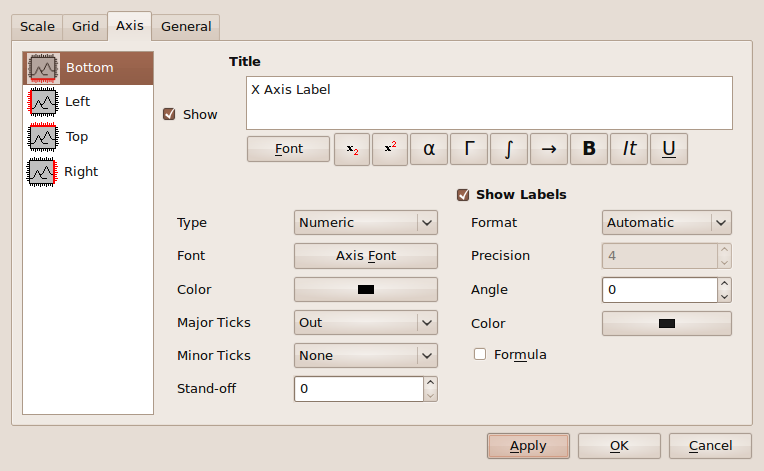
Axis options 
Scale options Once you're finished specifying your graph's visual parameters, it's then easy as pie to save it. Click File > Export Graph > Current, then choose a folder to save your graph in, name it, then press Save and you're done!
Conclusion The truth of the matter is that you need to choose the right tool for the right job. I have often found that it was necessary for me to load data to be plotted into Ipython that I wouldn't have been able to read into R. IPython provides the opportunity for easy interactive plotting for simple one-graph projects, but can scale up to more complex programmatic plotting in larger projects. It hasn't been often that I've had to do larger scale projects where many plots are outputted programmatically, but IPython would certainly be the environment of choice for me.
R has amazingly expansive plotting capabilities and certainly does not lose points on graphical quality. As you can see however, its syntax can be difficult to manage. I've used R for making summary plots of data that I also had to statistically analyze. Therein lies the ultimate use of R; it provides a single integrated environment for the plotting and analyzing of many different types of data.
When it comes down to it, however, I am quite lazy. I only recently discovered QtiPlot, and I think it's great! According to the QtiPlot website, it even provides an interface that allows you to script QtiPlot operations using Python. I don't know anything about that interface just yet, but it makes me very impressed with the program overall. Given my laziness, the quality of the plots that come out of QtiPlot, and the ease with which you can manipulate them, QtiPlot rates very highly in my books. I will surely be using it more in the future for plotting where the data is easily accessible and will highly recommend it to others.
- Pylab via Ipython
- The R Statistical Computing Environment and
- QtiPlot
In the sample dataset above, I've included an "X Axis" column composed of 7 integers simply called X. I've also included two Y columns of means and two columns containing the Standard Errors of the datasets from which those means came. My plotting aim was to create a plot containing two lines describing the two Y columns and error bars matching the values from the two Standard Error columns.
As you can see from the above plots, no one of these three software packages produces a bad looking plot. Some of the graphical parameters (such as font size, type of major axis ticks, whether or not a full box is drawn around the plotting area, and how far the plot title is from the top of the plotting area) are different from program to program, but that's more a matter of my unwillingness to get the programs to output exactly similar graphs than an inability in the programs themselves.
First and foremost is the fact that Pylab and R require you to type in some code to do your plotting whereas QtiPlot gives you a point-and-click GUI interface to complete the task. Pylab and R have their own idiosyncratic syntax for plotting, but thankfully neither requires much more code than the other. If you didn't know already, Pylab is a module of python and therefore allows you to seamlessly weave plotting commands into pure python code. It will therefore be advantageous for anyone who already has a Python background to use Pylab. Below I will show you the code I used to make the plots.
Pylab via IPython
- infile = open('/home/inkhorn/Documents/data.csv','rb')
- data = loadtxt(infile, delimiter=',')
- errorbar(data[:,0], data[:,1], yerr=data[:,2],color='b',ecolor='k',elinewidth=1,linewidth=3);
- errorbar(data[:,0], data[:,3], yerr=data[:,4],color='r',ecolor='k',elinewidth=1,linewidth=3);
- axis([-0.2, 6.2, .3, 1.0]);
- xlabel('X Axis Label', fontsize=14);
- ylabel('Y Axis Label',fontsize=14);
- title('Line Plot with Error Bars',fontsize=16);
R
- error.bar <- function(x, y, upper, lower=upper, length=0.1,...){ if(length(x) != length(y) | length(y) !=length(lower) | length(lower) != length(upper)) { stop("vectors are not the same length")} else { arrows(x,y+upper, x, y-lower, angle=90, code=3, length=length, ...)} }
- data = read.csv('/home/inkhorn/Documents/data.csv')
- png('/home/inkhorn/Desktop/test.png', height=1033, width=813, type=c("cairo"))
- plot(data$y2 ~ data$x, type="l",col='red',lwd=4,ylim=c(.3,1),main='Line Plot with Error Bars', xlab="X Axis Label", ylab="Y Axis Label")
- par(new=TRUE)
- plot(data$y1 ~ data$x, type='l', col='blue', lwd=4, axes=FALSE,ylim=c(.3,1),ann=FALSE)
- error.bar(data$x, data$y1, data$y1err)
- error.bar(data$x, data$y2, data$y2err)
- dev.off()
You then choose your data to import, specify the separator, whether or not you want to ignore lines at the top, then press OK.
You are then shown your data in a Table view and must now right click on the columns and set their roles as shown above. As you can see, your columns can represent X variables, Y variables, Y error variables, even 3rd dimension, or Z variables. When you're done setting your column roles, navigate to the Plot menu and click on Line, as shown below.
A line plot will then be generated, using default values that you can change to your heart's content. The plot title and axis titles are very easy to change; all you have to do is double click on them and edit the default text that is already there. If you want to change any other aspect of the graph, it suffices to right-click on that part of the graph, and then click on Properties, such as what I did below with one of the lines on the graph.
You can also modify how you want each of your axes to look by right clicking on the numbers of that axis and again clicking Properties. You can then change some general graphical properties of each axis, or change the way that the axis is scaled.
R has amazingly expansive plotting capabilities and certainly does not lose points on graphical quality. As you can see however, its syntax can be difficult to manage. I've used R for making summary plots of data that I also had to statistically analyze. Therein lies the ultimate use of R; it provides a single integrated environment for the plotting and analyzing of many different types of data.
When it comes down to it, however, I am quite lazy. I only recently discovered QtiPlot, and I think it's great! According to the QtiPlot website, it even provides an interface that allows you to script QtiPlot operations using Python. I don't know anything about that interface just yet, but it makes me very impressed with the program overall. Given my laziness, the quality of the plots that come out of QtiPlot, and the ease with which you can manipulate them, QtiPlot rates very highly in my books. I will surely be using it more in the future for plotting where the data is easily accessible and will highly recommend it to others.
Tuesday, January 19, 2010
How to screw up then fix Gnome in Ubuntu!
Yesterday I read about a supposedly nice-looking patched version of Nautilus and decided to try it out. I installed it, used it for a few hours before bed, and realized that I really hadn't gained anything special by installing it.
When I uninstalled it this morning, I really screwed up my installation of gnome. So much so that I simply couldn't log into ubuntu using the Gnome Display Manager (the meat and bones of the Ubuntu Grahpical User Interface). Thankfully, I still had access to the Virtual Console by pressing Control+Alt+F2 at the login screen.
One thing I learned is that I still don't know how to initialize an ethernet connection to my router/DSL modem to give me an internet connection from the command line. I know that you can set your ethernet interface's IP address by typing in sudo ifconfig eth0 address and you can substitute address with netmask address to change the netmask (I think it's usually 255.255.255.0 on most consumer routers). That didn't work for me however. I also tried toying with the route command, but I really didn't understand how to work with that.
What ended up saving me was a suggestion that I read on ubuntuforums.org, in response to someone in a similar situation, that they should download an alternative ubuntu installation iso, burn it to CD and use it as a source for package updates. I didn't end up burning it to CD. Rather, I did the following:
I'm definitely going to keep an alternative install ISO on me and probably also a regular install ISO too. After-all, they are free tools that don't even need to be burned to CD.
When I uninstalled it this morning, I really screwed up my installation of gnome. So much so that I simply couldn't log into ubuntu using the Gnome Display Manager (the meat and bones of the Ubuntu Grahpical User Interface). Thankfully, I still had access to the Virtual Console by pressing Control+Alt+F2 at the login screen.
One thing I learned is that I still don't know how to initialize an ethernet connection to my router/DSL modem to give me an internet connection from the command line. I know that you can set your ethernet interface's IP address by typing in sudo ifconfig eth0 address and you can substitute address with netmask address to change the netmask (I think it's usually 255.255.255.0 on most consumer routers). That didn't work for me however. I also tried toying with the route command, but I really didn't understand how to work with that.
What ended up saving me was a suggestion that I read on ubuntuforums.org, in response to someone in a similar situation, that they should download an alternative ubuntu installation iso, burn it to CD and use it as a source for package updates. I didn't end up burning it to CD. Rather, I did the following:
- downloaded it to my USB stick
- mounted the ISO in a newly made separate directory directory (using the command sudo mount -o loop ubuntu-9.10-alternate-i386.iso /media/testing)
- navigated to that directory (cd /media/testing)
- switched bash into root mode (sudo bash -i)
- Finally I initialized an upgrade from the mounted Alternative Install ISO (./cdromupgrade)
I'm definitely going to keep an alternative install ISO on me and probably also a regular install ISO too. After-all, they are free tools that don't even need to be burned to CD.
Monday, January 18, 2010
pyBloggerU now has a GUI
Yesterday I sat myself in front of both Qt 4 Designer and Wing IDE and didn't tear myself away from my computer until I finished a GUI for pyBloggerU.
For those who didn't read my original post on the matter, pyBloggerU is a script I made that will upload an html file containing your Blogger post and images to your Blogger account for online publication. The script deals with the weirdnesses inherent in how Blogger mangles the HTML code so that what you see in your HTML editor is not what you get on Blogger.
Unfortunately it still is not programmed to handle HTML files generated from WYSIWYG editors, as they create too many complications for me to be able to handle with this script. But I've found that creating blog posts in an HTML editor called Quanta Plus to be easy enough. Quanta Plus has lots of buttons that shoot out HTML code for you, code and tag completion, and even a Visual preview mode if you're interested.
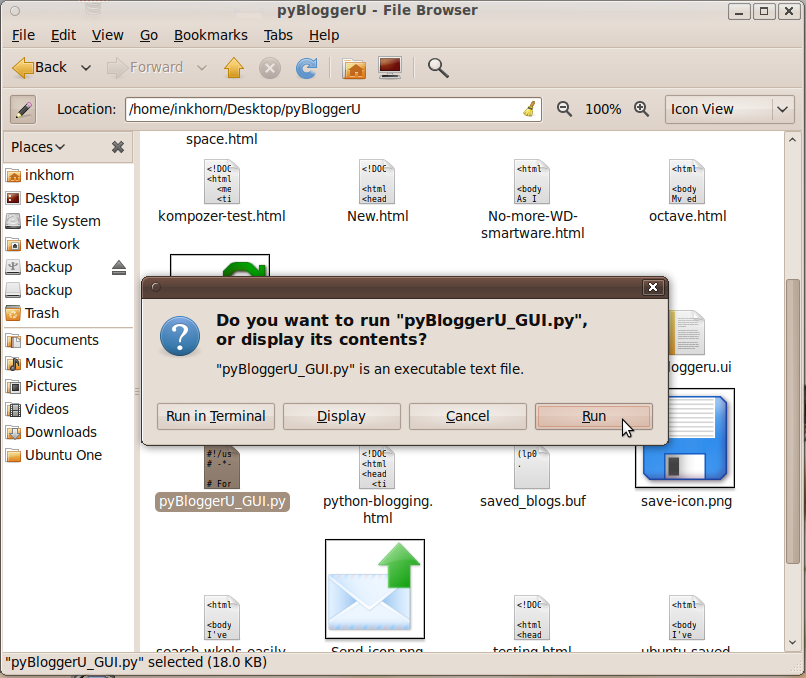
Once you've created your blog post in an HTML editor, like Quanta Plus, you just double click on the pyBloggerU_GUI.py file, press Run at the next window and enter in all the details shown in the picture below:
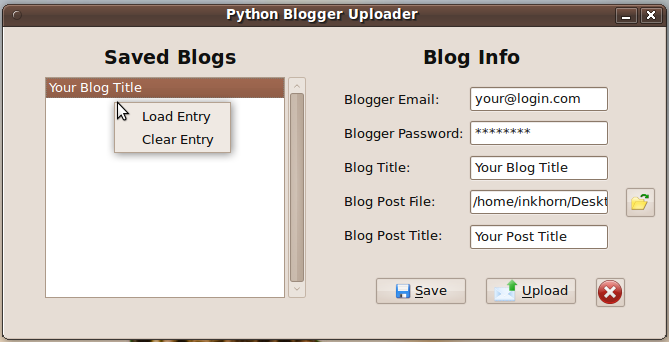
Be sure that any images referred to in the HTML contain their full file paths (the one above is "/home/inkhorn/Pictures/pyBloggerU.png") so that pyBloggerU will be able to upload them from your computer to your Blog's picasa web album. When everything is set, you can press the Upload button and your HTML file will become your blog post! When pyBloggerU succeeds at sending a blog post, you'll see a "Success" information window pop up a few moments after pressing the Upload button. Also, you'll be able to save your Blogger account info by pressing Save after filling out all the fields. When you have a new post to upload to blogger, you can then double click on the entry in the list to the left and your email, password, and blog title will appear in the fields to the right.
If you would like to download pyBloggerU, it's easily acccessible as a Bazaar branch on Launchpad. Even if you don't know what a Bazaar branch on Launchpad is, go to your terminal, and type in bzr branch lp:pybloggeru. This will create a directory called pybloggeru in your home directory and will store the python files for the program and all of its dependencies therein.
Of course if you would like to report a bug, ask a question, or contribute to the program, use the web utilities on the official pyBloggerU launchpad page.
For those who didn't read my original post on the matter, pyBloggerU is a script I made that will upload an html file containing your Blogger post and images to your Blogger account for online publication. The script deals with the weirdnesses inherent in how Blogger mangles the HTML code so that what you see in your HTML editor is not what you get on Blogger.
Unfortunately it still is not programmed to handle HTML files generated from WYSIWYG editors, as they create too many complications for me to be able to handle with this script. But I've found that creating blog posts in an HTML editor called Quanta Plus to be easy enough. Quanta Plus has lots of buttons that shoot out HTML code for you, code and tag completion, and even a Visual preview mode if you're interested.
Once you've created your blog post in an HTML editor, like Quanta Plus, you just double click on the pyBloggerU_GUI.py file, press Run at the next window and enter in all the details shown in the picture below:
Be sure that any images referred to in the HTML contain their full file paths (the one above is "/home/inkhorn/Pictures/pyBloggerU.png") so that pyBloggerU will be able to upload them from your computer to your Blog's picasa web album. When everything is set, you can press the Upload button and your HTML file will become your blog post! When pyBloggerU succeeds at sending a blog post, you'll see a "Success" information window pop up a few moments after pressing the Upload button. Also, you'll be able to save your Blogger account info by pressing Save after filling out all the fields. When you have a new post to upload to blogger, you can then double click on the entry in the list to the left and your email, password, and blog title will appear in the fields to the right.
If you would like to download pyBloggerU, it's easily acccessible as a Bazaar branch on Launchpad. Even if you don't know what a Bazaar branch on Launchpad is, go to your terminal, and type in bzr branch lp:pybloggeru. This will create a directory called pybloggeru in your home directory and will store the python files for the program and all of its dependencies therein.
Of course if you would like to report a bug, ask a question, or contribute to the program, use the web utilities on the official pyBloggerU launchpad page.
Thursday, January 14, 2010
Enjoy your WD My Book 1TB Drive: No more WD SmartWare icon in Ubuntu!
As I mentioned in my last post, I recently picked up a Western Digital My Book Essential 1 TB external hard drive. Although it doesn't as yet display the same problems that my Simpletech hard drive was having, it does come with an annoying Virtual CD installed, literally in the unit's firmware, that contains Western Digital's SmartWare backup software. Of course the software is not linux compatible and wouldn't be something I would want to use anyway. The big question I had was: how do I get rid of it?
Well the problem has been well documented on the internet, with many people complaining about it. I found a helpful comment on a blog maintained by a mac admin. User 'yakkoj' suggests in his comment to make an entry in the /etc/fstab file on your mac that basically tells Mac OSX to ignore the Virtual CD so that it doesn't load and show up on your desktop. As Mac OSX is a relative of Linux, his comment was easily adaptable as a solution for my Ubuntu system too! Following is the line that I put in my /etc/fstab file and I can vouch that I now no longer see an icon for the WD Smartware Virtual CD on my desktop:
/dev/sr1 none udf rw,noauto 0 0
The Virtual CD always shows up as /dev/sr1, and I don't think there's any danger of other devices taking up that partition label. So, put the above line into your /etc/fstab file, and it will basically tell Linux that any time a device pops up and wants to inhabit the /dev/sr1 partition then it shouldn't be mounted at all. Then you will no longer have to stare at the dumb WD SmartWare icon on your linux desktop again! However, please note that this does not in fact rid the hard drive of the software, it just tells your computer to ignore it.
Wednesday, January 13, 2010
Bye bye Simpletech and Windows, Hello more space for Ubuntu!
Today I exchanged my terrible terrible Simpletech 500GB [re]Drive for a sleek looking Western Digital 1TB My Book Essential. After filling the new backup drive with the files I previously had on the Simpletech, I had a mind to doing some spring cleaning on my Windows Vista partition.
Yes, I still had Windows Vista after approximately 5 months of using Ubuntu as my primary operating system. I moved some files and folders that I wanted to keep from my Vista partition to the backup drive and then thought it was about time to get rid of Windows and its partition. I never use it anymore! I only had 45 GB allocated to my active Linux partition (ext4 filesystem) and space was beginning to look a little scarce.
So I downloaded a Knoppix iso (little did I know it was German!), burned it to CD, booted off of it, used GParted to get rid of my Windows partition and resized my active Linux partition. It took about 40 minutes to complete but now my computer is rid of Windows! Now Ubuntu has a 148 GB partition to run off of with 120 GB of free space :)
Bye bye Windows, nice knowing ya!
Tuesday, January 12, 2010
Search Workopolis Easily with Python
I've been looking for jobs lately and thought how nice it would be if I could skip the rigamarole of opening up my browser, going to a job search website, typing in the search arguments, and sifting through the results. In view of making job searching a little easier, I've made a Python script that for now will search Workopolis.com using keywords and a city location that you, the user, specify. It will then output a csv (comma separated value) file containing the job search results in the directory where you executed the script. You can then open the search results at your leisure, sift through them without the annoyances of advertisements, and possibly add them to your own database.
Just like pyBloggerU, I've uploaded the files for this Python script to launchpad for others to see and modify at their leisure. Go here if you'd like to download the program files, and here if you'd like to read more and possibly contribute to the project!
Once you put the program files in a particular directory, go to your command line, type python PyJobFinder.py, and then answer the questions that it asks you. Quickly after putting in your search terms, the program tells you the file name of the job results file and then you're free to open it up!
Friday, January 8, 2010
View a Windows desktop remotely with Ubuntu and xvnc4viewer
Today I needed to give on-the-phone support to a colleague concerning a MATLAB program that I contributed to developing. If you've ever tried to tell someone what to do on their computer without having a similar screen in front of you on the computer, you'll know that it's not easy. To remedy the situation, I looked on the net for a program/protocol to use to view my colleague's desktop remotely. I found out that there is a protocol called VNC (Virtual Network Computing) for which there are client/server applications available on Windows and Ubuntu.
I got my colleague to install a VNC server for Windows called TightVNC, while I installed a VNC viewer for Ubuntu called xvnc4viewer. It was pretty easy for us to get the connection running. She only had to enter in a password for accessing her VNC server, and needed to tell me her public IP address. TightVNC tells you the IP address(es) that your server is broadcasting on when you hover your mouse cursor over the V icon that shows up in your system tray.

Above I've shown you the Connect Options window for xvnc4viewer so that you can see what can be changed. However, the only options I changed were Colour Level (to Full Colour) and I enabled Full Screen Mode. Once she told me her public IP address, I just had to enter it into the textbox in the VNC Viewer: Connection Details main window shown above and press okay. Upon connection, the VNC viewer expands as much as it can to accomodate the resolution of the VNC server's screen and then anything they do on their computer can be seen on your computer! It's pretty cool except I'm not sure it allows the person with the viewer to control anything on the server's computer. That was acceptable for my over-the-phone support, as I only needed to see what she was seeing!
If you want to install xvnc4viewer for ubuntu, simply open the terminal and type sudo apt-get install xvnc4viewer. Easy peazy right? Once you have it installed, to start it up, go to the terminal and type in xvnc4viewer. That's all!
I got my colleague to install a VNC server for Windows called TightVNC, while I installed a VNC viewer for Ubuntu called xvnc4viewer. It was pretty easy for us to get the connection running. She only had to enter in a password for accessing her VNC server, and needed to tell me her public IP address. TightVNC tells you the IP address(es) that your server is broadcasting on when you hover your mouse cursor over the V icon that shows up in your system tray.
Above I've shown you the Connect Options window for xvnc4viewer so that you can see what can be changed. However, the only options I changed were Colour Level (to Full Colour) and I enabled Full Screen Mode. Once she told me her public IP address, I just had to enter it into the textbox in the VNC Viewer: Connection Details main window shown above and press okay. Upon connection, the VNC viewer expands as much as it can to accomodate the resolution of the VNC server's screen and then anything they do on their computer can be seen on your computer! It's pretty cool except I'm not sure it allows the person with the viewer to control anything on the server's computer. That was acceptable for my over-the-phone support, as I only needed to see what she was seeing!
If you want to install xvnc4viewer for ubuntu, simply open the terminal and type sudo apt-get install xvnc4viewer. Easy peazy right? Once you have it installed, to start it up, go to the terminal and type in xvnc4viewer. That's all!
Thursday, January 7, 2010
Ubuntu Rescue Remix helped factory reset my Acer Netbook!
I've had an Acer Aspire One Netbook for a bit longer than a year now and I finally have no more use for it. It's been a fantastic little computer, serving its purpose in letting me take notes in grad classes when I've needed it. It's incredibly light (2.2 lbs), runs Windows XP, has a big enough hard drive (120 GB), 3 USB ports, digital camera memory readers and a wifi Anyway, it's not my intention to sell my netbook over my blog. I am however intending on selling it to people over craigslist. In order to give it to someone, I needed to restore the netbook to its manufacturer intended state. Conveniently, Acer shipped these things with windows install files on a separate partition. Not so conveniently, their "erecovery" program they make available to download for this purpose doesn't do a thing! I was very frustrated and wanted a way of getting to those install files on the separate partition.
Along the way I thought of using a Live USB version of linux to somehow get to those files. At first I tried Ubuntu Rescue Remix version 9.10. The website provides you with an ISO, which you then use in conjunction with USB Startup Disk Creator (accessible by clicking System > Administration > USB Startup Disk Creator).
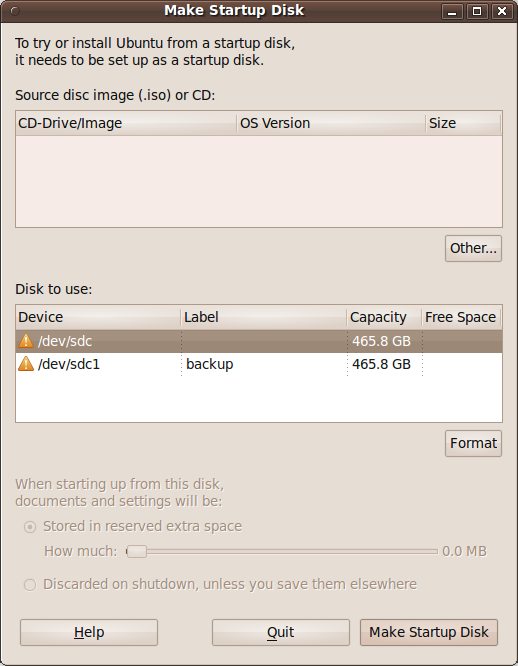
You press the Other button above in order to load up the ISO file that you downloaded. Then you look for your USB stick partition at the bottom (you probably have a pet name you assigned to it) and click Make Startup Disk. This organizes your USB stick accordingly and allows you to boot using Ubuntu Rescue Remix. Weirdly, version 9.10 didn't work for me, but 9.04 worked just fine. Be warned, it does boot you into a command line interface, but you don't have to know very much to proceed. All I had to do was:
Ubuntu saved Windows, how about that?!!?
Along the way I thought of using a Live USB version of linux to somehow get to those files. At first I tried Ubuntu Rescue Remix version 9.10. The website provides you with an ISO, which you then use in conjunction with USB Startup Disk Creator (accessible by clicking System > Administration > USB Startup Disk Creator).
You press the Other button above in order to load up the ISO file that you downloaded. Then you look for your USB stick partition at the bottom (you probably have a pet name you assigned to it) and click Make Startup Disk. This organizes your USB stick accordingly and allows you to boot using Ubuntu Rescue Remix. Weirdly, version 9.10 didn't work for me, but 9.04 worked just fine. Be warned, it does boot you into a command line interface, but you don't have to know very much to proceed. All I had to do was:
- Press the Enter key when the login screen showed up
- Type in sudo parted to load the Partition Editor
- Type in print all in order to list my partitions
- Type in set 1 boot on to make the windows installation partition bootable (I think it was partition 1, you'll probably have to play around to be sure which is the windows installation files partition)
- Type in quit
- Then I shutdown my computer, made sure the USB stick was out, turned it back on and voila, the Acer windows restore utility started running!
Ubuntu saved Windows, how about that?!!?
Monday, January 4, 2010
Matlab's free cousin Octave
My educational/work background is in experimental science. Therefore, much of what I've done for work purposes involves processing data, plotting data, and analyzing data. I did most of the data processing and plotting in Matlab. Matlab is a fantastic language for scientific computation which is even available for Linux. Of course, the downside to Matlab is that liscences for it cost big bucks outside of academia!
Recently, I discovered another language for scientific computation called Octave. The amazing thing about it is that it is a free-to-download, extensively Matlab-like language! In other words, if you already know Matlab, you barely have to learn anything new in order to use Octave. The functionality is VERY similar, with Octave able to do things like Matrix operations, Signal Processing, Statistics, Scripting and Plotting. I installed Octave in Ubuntu by typing
sudo apt-get install octave into the terminal. Unexpectedly, Octave came packaged in the Ubuntu repository with QtOctave, a complete graphical development interface for working with scientific data. Check out the screenshot below:

As you can see, the GUI includes the most important elements found in the Matlab GUI:
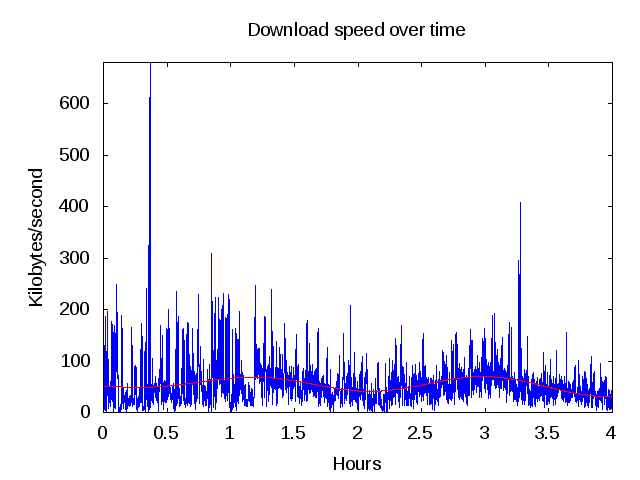
If you've ever done any plotting in Matlab, you'll recognize the same graphics quality in the graph above. Just like Matlab, the default plotting parameters aren't the prettiest, but that's okay. The important thing is that Octave is free, it's sophisticated, and very easy to use for Matlab veterens!
Recently, I discovered another language for scientific computation called Octave. The amazing thing about it is that it is a free-to-download, extensively Matlab-like language! In other words, if you already know Matlab, you barely have to learn anything new in order to use Octave. The functionality is VERY similar, with Octave able to do things like Matrix operations, Signal Processing, Statistics, Scripting and Plotting. I installed Octave in Ubuntu by typing
sudo apt-get install octave into the terminal. Unexpectedly, Octave came packaged in the Ubuntu repository with QtOctave, a complete graphical development interface for working with scientific data. Check out the screenshot below:
As you can see, the GUI includes the most important elements found in the Matlab GUI:
- The command prompt
- A command history
- An area to access all the variables/data loaded into memory
- A filesystem navigator
- Finally, a script editor window (accessible via the fat red pen icon
If you've ever done any plotting in Matlab, you'll recognize the same graphics quality in the graph above. Just like Matlab, the default plotting parameters aren't the prettiest, but that's okay. The important thing is that Octave is free, it's sophisticated, and very easy to use for Matlab veterens!
Sunday, January 3, 2010
Tis a Gift to be Simple
Today I got interested in trying out a few different blogging sites (wordpress.com and tumblr.com) to see if either one of them provided a better/easier interface to work with than blogger. Going on Wordpress, I saw an interface that was both sophisticated and nice looking. Wordpress seemed to have everything.
Unfortunately there were a few drawbacks:
Until then, "tis a gift to be simple". Thanks Blogger!
Unfortunately there were a few drawbacks:
- Wordpress seems to intentionally set the width of your "Content Column" (the column within which your blog post appears) to be too narrow for my liking. Resultantly, the bigger pictures that I post appear to be cut off :(
- After investigating possible solutions to my first problem, I found out that I would need to pay a fee to customize the width (along with other features) of my blog to my liking. I don't like that at all.
- Even if I was to live with the narrow width thing, I am surprised that Wordpress doesn't automatically size your pictures according to the width of your content column.
Until then, "tis a gift to be simple". Thanks Blogger!
Friday, January 1, 2010
Blog from your HTML Editor and Python
So this is a test of the Python script I made to upload a custom made HTML file to my blog. As I mentioned in my last post, Google has provided its own Python Client Library to the public for connecting to Google's various services. What really confused me at first was the question of where exactly Google stores the pictures you want on your blog when you use the regular Blogger New Post interface. I soon discovered that if you're not linking to a picture that's on another website, any picture you put on your Blogger Blog is actually stored under a Picasa Web Album named after your blog and accessible by your Blogger account username and password. Knowing this, I just had to follow a few simple steps for using the Python Client Library to automatically upload pictures to the user's Picasa Web album (see here).
What I figured out is that if you want to put pictures on your blog post, you don't need to know where they'll be uploaded to. Just link to the pictures on your local hard drive and submit your HTML blog post file to my script. My script then:
Also, I noticed that Blogger ignores the header/footer html tags found in all web pages like <html>, </html>, <head>, </head>, <body>, and </body> but retains the newline codes that follow them all. Finally, when Blogger processes <br> tags that are followed by a newline code, it creates two new lines. To fix this using my script, I made it so that the inputted HTML file gets sliced from the end of the first <body> tag to just before the beginning of the </body> tag. As well, it gets rid of all <br> tags, leaving only newline codes in their places. At the moment it's a command line script that I haven't yet tested on Windows. If you'd like to take a stab at using it, download it here. To make life easy, download it to the directory where you're saving your HTML blog post file and just call it from the command line by running python pyBloggerU.py. The program will ask you for the following pieces of information:
If you'd like to help me out, I've registered my project in launchpad and you can submit a branch of my code. Go here
if you want to donate your time to help me out :).
And now finally, it's time for me to test out media uploading:

What I figured out is that if you want to put pictures on your blog post, you don't need to know where they'll be uploaded to. Just link to the pictures on your local hard drive and submit your HTML blog post file to my script. My script then:
- looks for any local image links
- uploads those files to your Picasa Web Album
- gets the URLs of your newly uploaded images
- Uses those URLs to replace the local path links in your HTML file, and finally
- Uploads your newly modified HTML file to Blogger!
Also, I noticed that Blogger ignores the header/footer html tags found in all web pages like <html>, </html>, <head>, </head>, <body>, and </body> but retains the newline codes that follow them all. Finally, when Blogger processes <br> tags that are followed by a newline code, it creates two new lines. To fix this using my script, I made it so that the inputted HTML file gets sliced from the end of the first <body> tag to just before the beginning of the </body> tag. As well, it gets rid of all <br> tags, leaving only newline codes in their places. At the moment it's a command line script that I haven't yet tested on Windows. If you'd like to take a stab at using it, download it here. To make life easy, download it to the directory where you're saving your HTML blog post file and just call it from the command line by running python pyBloggerU.py. The program will ask you for the following pieces of information:
- The email address associated with your Blogger account
- Your Blogger account password
- Your Blog title (case insensitive), and finally
- Your Blog post title
If you'd like to help me out, I've registered my project in launchpad and you can submit a branch of my code. Go here
if you want to donate your time to help me out :).
And now finally, it's time for me to test out media uploading:
Subscribe to:
Posts (Atom)

