Recently, I discovered another language for scientific computation called Octave. The amazing thing about it is that it is a free-to-download, extensively Matlab-like language! In other words, if you already know Matlab, you barely have to learn anything new in order to use Octave. The functionality is VERY similar, with Octave able to do things like Matrix operations, Signal Processing, Statistics, Scripting and Plotting. I installed Octave in Ubuntu by typing
sudo apt-get install octave into the terminal. Unexpectedly, Octave came packaged in the Ubuntu repository with QtOctave, a complete graphical development interface for working with scientific data. Check out the screenshot below:

As you can see, the GUI includes the most important elements found in the Matlab GUI:
- The command prompt
- A command history
- An area to access all the variables/data loaded into memory
- A filesystem navigator
- Finally, a script editor window (accessible via the fat red pen icon
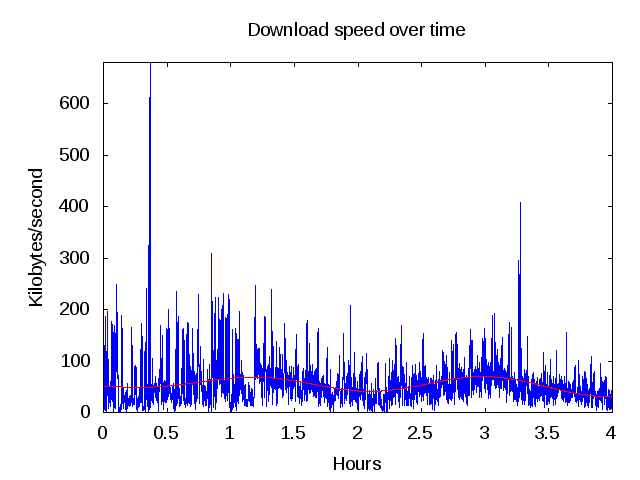
If you've ever done any plotting in Matlab, you'll recognize the same graphics quality in the graph above. Just like Matlab, the default plotting parameters aren't the prettiest, but that's okay. The important thing is that Octave is free, it's sophisticated, and very easy to use for Matlab veterens!


For another good time, try FreeMat. It is a very simple and compatible (works with .m files and standard MatLab formatting) numeric tool. This is written for both Linux and Windows.
ReplyDeleteqtoctave is dead. There is another one Xoctave from www.xoctave.com
ReplyDeletepusulabet
ReplyDeletesex hattı
https://izmirkizlari.com
rulet siteleri
rexbet
QZF
https://saglamproxy.com
ReplyDeletemetin2 proxy
proxy satın al
knight online proxy
mobil proxy satın al
4M73B
Thanks ffor this
ReplyDelete